 On Day 34, we described how the visual team logs their sightings on a tablet PC. The visual sightings are then sent from the visual team on the bridge's roof all the way down to the science lab via a serial cable. In the lab, the information is received on a dedicated computer that also receives ship information and acoustic sightings. The ship information is received from the bridge via a serial cable and the acoustic sightings are received from the acousticians' computers in the science lab through our local network.
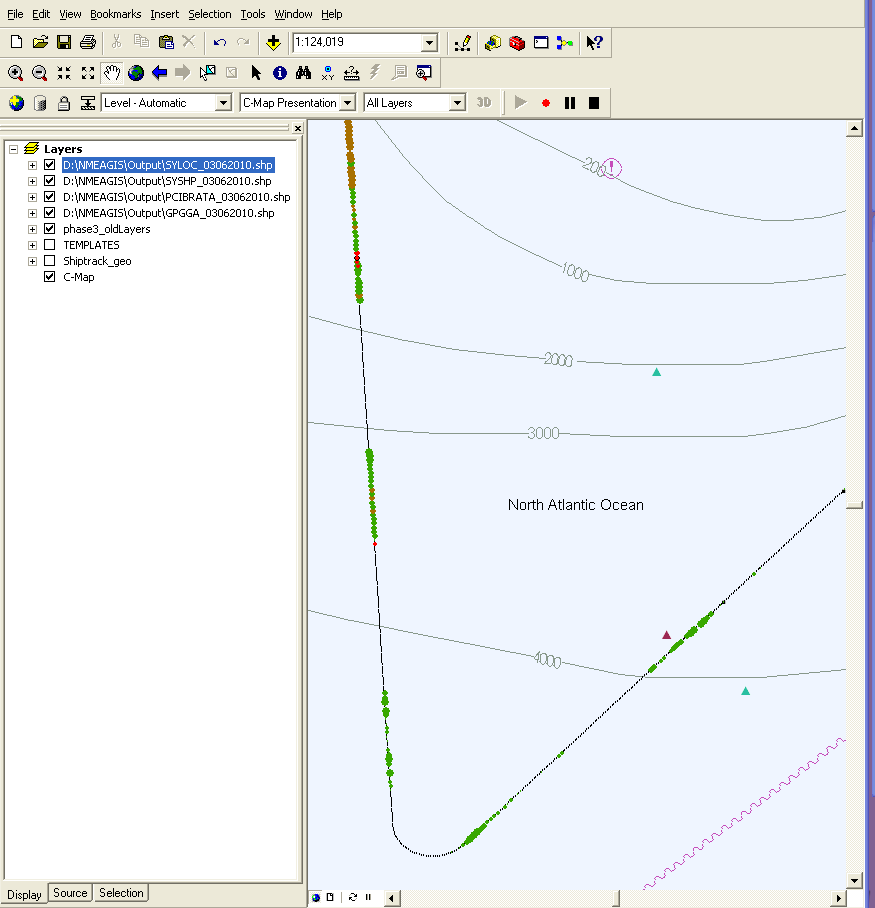
The GIS computer combines all information on a map, showing where the ship is, was, and what sightings were made. Acoustic sightings are placed on the ship track, because the location of the animal is not precisely known, with different colours and sizes representing the various species and loudness. The visual sightings include bearing and distance and can therefore be placed at the appropriate locations relative to the ship's position at the time of the sighting. This information is also color-coded per species.
The combined information is primarily useful for post-cruise evaluation.
During Sirena10, the map is not shown to everyone, to make sure that visual results will not influence acousticians' perceptions of the received audio.


No comments:
Post a Comment